14. Reporting
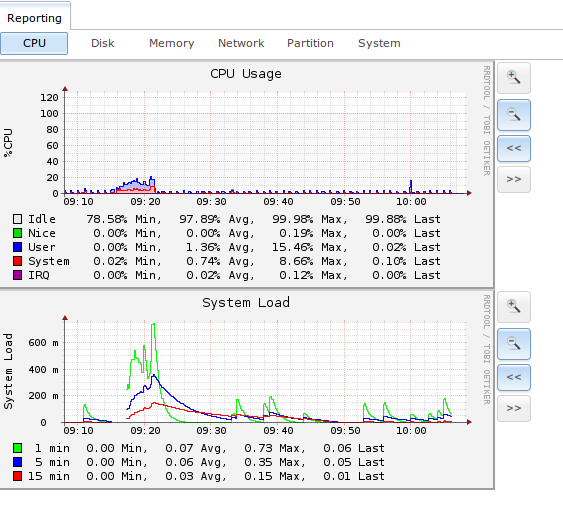
Reporting displays several graphs, as seen in the example in Figure 14a. Click the tab for a device type to see its graphs.
Figure 14a: Reporting Graphs
FreeNAS® uses collectd to provide reporting statistics. The following collectd plugins are enabled in /conf/base/etc/local/collectd.conf, and thus provide reporting graphs:
- CPU usage : collects the amount of time spent by the CPU in various states such as executing user code, executing system code, and being idle.
- system load : provides a rough overview of system utilization over a one, five, and fifteen minute average.
- disk : shows the average time a disk I/O operation took to complete.
- physical memory : displays physical memory usage.
- swap utilization : displays the amount of free and used swap space.
- interface : shows received and transmitted traffic in bits per second for each configured interface.
- disk space : displays free and used space for each volume and dataset. However, the disk space used by an individual zvol is not displayed as it is a block device.
- processes : displays the number of processes, grouped by state.
- uptime : keeps track of the system uptime, the average running time, and the maximum reached uptime.
- zfs : shows ARC and L2ARC size and hit rates.
Reporting data is saved, allowing you to view and monitor usage trends over time. By default, reporting data is saved to /data/rrd_dir.tar.bz2 and should be preserved across system upgrades and at shutdown. To instead save this data to the system dataset, check the “Reporting database” box in System ‣ System Dataset.
Use the magnifier buttons next to each graph to increase or decrease the displayed time increment from 10 minutes, hourly, daily, weekly, or monthly. You can also use the “<<” and “>>” buttons to scroll through the output.